Every craft statistics page on the internet quotes the same five studies. This one quotes our bookings. We recently published three statistics pages built on other people's research, every number traced to its primary source. This page is the opposite experiment: 39 statistics with no Gallup, no universities and no market-research firms — just 26 months of orders through kraftstories.com, a year of our search and traffic data, and what seven studios plus a virtual program can see from the inside.
A few ground rules, because publishing your own data honestly means saying what it is. These figures cover direct online orders from June 2024 through August 2026 — classes, kits, wholesale packs and private-event invoices booked through our own store. Bookings made through marketplaces, by phone, or in person at the studios are not in the order data, so this is a large window into the business, not the whole business. We publish shares, ratios and indexes rather than dollar totals, we name the time window on every number, and where a stat makes us look bad we have left it in.
The ten numbers we would put on a poster
- December brings 2.8x the orders of an average month.
- A Manhattan booking averages 3.4 seats; a Honolulu booking averages 2.2.
- Half of all class bookings are made less than a week before the class — and Honolulu books nearly 3x further ahead than New York.
- A typical private-event order covers about 11 seats and is worth roughly two and a half standard orders.
- Two crafts — Turkish mosaic lamps and rug tufting — fill 57% of our seats.
- Search drives 20x more orders than social media.
- Instagram reached 7.9x our follower count last month — and produced 3 link taps.
- 29% of our Google clicks come from one search: “christmas trivia.”
- 92% of the people who click through from Google have never heard of us.
- We hold the #1 average local map position on 6 of the 14 keyword-and-market pairs we track.
- New York and Hawaii together are 74% of our location-page traffic.
Who books a craft workshop
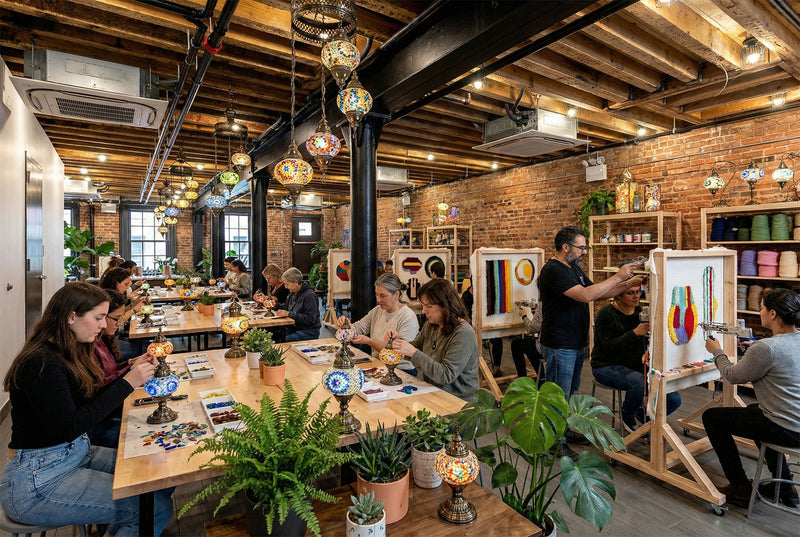
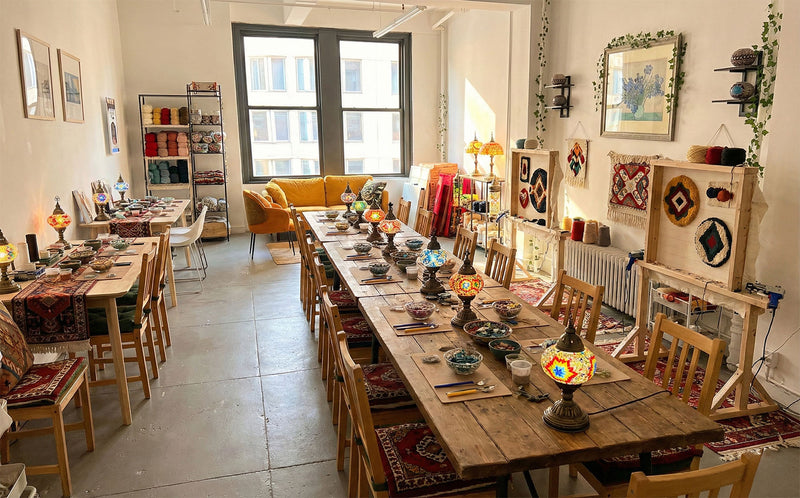
- New Yorkers book in groups; Honolulu books in pairs. Across 26 months, a class booking at our Manhattan studios averages 3.4 seats, against 2.2 seats in Honolulu. Hawaii is honeymooners and travelling couples; New York is birthday groups, date-night doubles and teams.
- Terrarium classes attract the biggest groups of anything we run. The Signature Terrarium averages 4.9 seats per booking in Midtown and 5.4 in the Financial District — roughly twice the group size of a mosaic lamp booking. If a workshop arrives five people at a time, it is usually a team.
- The average private-event order covers about 11 seats. Custom and invoice orders — mostly corporate events and private parties — average nearly 11 line items each, against 2 to 3 on a standard class booking.
- A private-event order is worth roughly 2.5 standard orders. Over 26 months the average custom invoice ran about 2.4x our overall average order value; in August 2026 alone it ran 2.7x. Group business is the revenue engine behind a consumer-looking storefront.
- Individuals and groups inquire in almost equal numbers. Of the form inquiries we received in August 2026, 49% were individuals and 45% were private-event and group requests — the rest were general questions. Half the people writing to a craft studio are organizing something for other people.
- About one order in five is a wholesale pack. Bulk 12-pack kits — mosaic lamps above all — are 21% of orders across our 40 best-selling lines, bought by venues, activity businesses and event planners who run craft nights of their own. Classes are 45%, retail kits and supplies 25%, and private-event invoices 8%.
- About 1 in 9 online customers has come back and ordered again. Our 26-month returning-customer rate is 11.2%. Honest context: workshops are an occasion purchase — birthdays, visits, team events — and rebookings made through marketplaces or over the phone never touch this number. We would still like it higher.
When people book
- December runs at 2.8x an average month. December 2025 brought 2.8 times the orders of the average 2025 month, and December 2024 ran 3.8x its trailing average. Handmade-gift season is not a marketing theory; it is the calendar's tallest bar, both years we have existed online.
- Orders arrive all week; classes happen on weekends. Over the past 12 months, the quietest ordering day of the week sits just 15% below the busiest — but the classes those orders book cluster hard at the weekend (see stat 16). People plan on Tuesday and make on Saturday.
- People book from their desks. Our single busiest ordering hour is 9–10 am Hawaii time — which is noon in California and 3 pm in New York. Across our customers' time zones, the ordering peak lands squarely in the working afternoon, and orders fade after dinner everywhere.
- Demand tripled in a year. The first half of 2026 brought 3.2x the online orders of the first half of 2025, and the summer held it: July–August 2026 ran 3x the same weeks a year earlier. We are counting orders, not dollars, so this is volume, not a price rise.
How far ahead people book
Booking-app data, roughly August 2025 through August 2026: 1,099 self-serve class bookings where we know both the order time and the class date. Private-event invoices and early-era manual orders are not in this cut.
- The median class is booked 5.2 days before it happens. 17.8% of bookings are made on the day of the class, 30.1% within 48 hours, and 58.3% within a week. A craft class is a this-week decision, not a someday plan.
- 45% of bookings are for a class in the same calendar week as the order — and only 8.9% are made 30 or more days out. If you are waiting for advance-purchase behavior, you are waiting for a customer who mostly does not exist.
- Honolulu books almost 3x further ahead than New York. Median lead time is 8.0 days for classes at the Honolulu studio against 2.8 days in New York (by class timezone, covering all 1,099 bookings). Travelers plan; locals decide after lunch.
- The bigger the group, the earlier the booking. Bookings for 1–2 seats are made a median 4.9 days ahead; 3–5 seats, 7.0 days; the small number of 6+ seat bookings run two weeks or more out. Group organizers are planners — which is why last-minute inventory is a solo-and-couples game.
- Three-quarters of classes attended fall on Friday through Sunday — 74.9%, with Saturday alone at 35.9% — even though the orders themselves arrive evenly across the week. The workweek is for booking; the weekend is for making.
- 5 pm is the single most common class start time. A quarter of all bookings (25.9%) are for a 5:00 start, 48.9% for early-afternoon slots, and 21.5% for mornings. The after-work hour is the craft hour, in both time zones we operate across.
Where the demand is
- Two markets carry three-quarters of the interest. In August 2026, New York pages took 41% of our location-page traffic and Hawaii took 33% — 74% between them. San Francisco, our virtual program, Irvine, San Jose and Los Angeles share the remaining quarter.
- New York fills 69% of the seats. Of the storefront seats sold in August 2026, 69% were in New York and 21% in Hawaii — so New York turned its 41% share of traffic into seats at well over twice Hawaii’s rate. A visitor market researches long before it commits; a local market just books.
- Honolulu is our single biggest source of visitors. Over the past 12 months, Honolulu sent more sessions to kraftstories.com than any other city on earth — 11.4% of all traffic, ahead of New York's 7.8%.
- Visitors arrived from 10,336 different cities in the past year — and customers have ordered from nine countries, though 96% of orders are American. Kits travel farther than people do.
- The virtual best-seller is a terrarium in a Victorian case. In August 2026, every virtual seat sold through the storefront was a Wardian Case terrarium build — one product carried the entire online-workshop column. On camera, plants beat flames; nobody has to ship a lit candle.
What people actually make
- Two crafts are nearly two-thirds of class bookings. Across 26 months of class orders, Turkish mosaic lamps take 33% and custom rug tufting 30%; terrariums are third at 15%, with candles, sea glass, moss walls, resin and Turkish coffee sharing the rest.
- In seat terms, the pair filled 57% of August. Turkish lamp and mosaic workshops sold the most seats of any line, with rug tufting second — the same two-horse race the 26-month data shows, still running.
- Rug tufting is the front door; what people buy depends on the city. The single most-viewed location page in New York and in Hawaii is Custom Rug Tufting. In New York, the people it brings in end up booking more mosaic-lamp seats than tufting seats; in Hawaii, tufting keeps the sale. Tufting gets the clicks everywhere — Manhattan just changes its mind at the checkout.
- Terrariums are the most searched, third-most booked. Terrarium and moss queries generate more Google impressions for us than any other craft theme — about 17% of all impressions, ahead of even mosaic lamps — but terrariums rank third in bookings. The gap between what people research and what they book is where our email list earns its keep.
How people actually find a craft class
This is the section we wish someone had published before we spent our first marketing dollar.
- Search outsells social 20 to 1. Of the past 12 months' orders with a known referrer source, search produced 20.6x as many as social media — 30% of attributed orders against under 2%.
- Instagram reach is real; Instagram revenue is not. Our account reached 7.9x its own follower count in 30 days — and the bio link was tapped 3 times against 33,412 people reached, a 0.009% rate. We keep posting because the studios photograph beautifully. We stopped expecting it to sell seats.
- 92% of our Google clicks are from people who have never heard of us. Branded searches are just 8% of the 47,000 clicks Google sent us in the past year, from 2.2 million appearances in results. For a young brand, search is not a channel; it is the front door.
- Our most-clicked search term is “christmas trivia.” That one query drove 29% of every Google click we received in 12 months, and the trivia and icebreaker family together nearly 39% — more than every workshop query combined. The money pages sell mosaic lamps; the traffic pages are Christmas trivia questions. We have made peace with it.
- A 65-year-old bottle garden outdraws our workshop pages. Our story on the world's oldest sealed terrarium earns more search clicks than any single workshop query we rank for. Curiosity content out-pulls commercial content, then hands it the audience.
- We hold the #1 average map position on 6 of 14 tracked local searches. On Google's local map grid we average position 1.0 with a 100% share of local voice for craft classes and rug tufting in Honolulu, Turkish lamp workshops in Midtown, tufting workshops in Midtown, craft classes in the Financial District and craft classes in San Francisco. And in the same scan, San Jose ranks nowhere at all on either tracked keyword — our own San Francisco listing outranks it across the South Bay. Both of those facts are ours; only one goes in the marketing deck.
The funnel, honestly
- People browse on desktops and book on phones. Mobile is 53% of our sessions over 12 months, but the split sharpens at the decisive step: in August, desktop visitors abandoned the date-and-time picker 69% of the time, against 43% on mobile. The office browser window is for dreaming; the phone is for committing.
- Six in ten started checkouts don't finish. August's begin-checkout-to-purchase abandonment was 58.9%. Anyone who tells you their booking funnel doesn't leak is not measuring it.
- The polite checkbox beats the popup 1.6 to 1. Of our genuinely new email subscribers in August, 51% came from the small opt-in checkbox at checkout; the site-wide popup, shown thousands of times, converted 0.93% of its views. The least annoying tool we run is also the most effective one.
- A quarter of the demand is outside the two flagships. San Francisco, our virtual program, Irvine, San Jose and Los Angeles together draw the 26% of location-page traffic that New York and Hawaii don't — a long tail of demand that is wider than the studio map, which is exactly what the virtual program is for.
Three things the numbers changed our minds about
- We thought bookings would cluster around the weekend. The order data says they arrive all week long, from desks, with December as the only true peak — so our scheduling, staffing and send-times now follow the data instead of the instinct.
- We thought social media was the growth channel. At 20-to-1, search is — so the writing budget goes to pages people search for, including, yes, trivia.
- We thought individuals were the core customer. Between 11-seat private invoices worth 2.5 standard orders, five-seat terrarium bookings and wholesale 12-packs, the group is the core customer; the individual is how groups first find us. It is why team events and virtual team building get their own front doors.
Methodology and scope
Order statistics cover June 2024 – August 2026 direct online orders through kraftstories.com, including private-event invoices raised in our store; bookings through class marketplaces, by phone or in person are excluded, so shares describe our direct online channel, not the entire company. Traffic, search, funnel and social figures come from our own analytics for the windows named on each statistic (the 12 months to August 2026, or August 2026 alone); traffic analytics have the usual measurement noise, and where our tracking is imperfect we have said so rather than smoothed it. Category and craft shares are computed across our 40 best-selling product lines. Lead-time and class-timing statistics cover the 1,099 self-serve bookings made since our booking app began recording class dates (roughly August 2025 onward); they reflect the slot chosen at purchase, so later reschedules are invisible. Percentages are rounded; we deliberately publish no revenue totals. We will refresh this page annually.
To cite this page: KraftStories (2026). The KraftStories Data Report: 39 Craft Workshop Statistics From Our Own Bookings. https://kraftstories.com/blogs/diy-and-crafts/kraftstories-data-report. Everything here is first-party — if you use a number, this page is the source. For industry-wide numbers with their sources traced, see our crafting statistics and team building statistics.
Frequently asked questions
Is this all of KraftStories' data?
No — it is our direct online channel over 26 months, plus a year of our own traffic and search data. Marketplace, phone and walk-in bookings sit outside these figures, which is why we publish shares and ratios rather than claiming totals for the whole business.
Why don't you publish revenue figures?
Because the useful part of a statistic is the shape, not our bank balance. Ratios — December at 2.8x, private events at 2.5x, search at 20-to-1 — travel well and stay true longer than dollar figures would.
Can I use these statistics?
Yes, with a link to this page as the source. They describe one craft workshop company, not the industry — if you need industry-wide data, our sister statistics pages trace every external number to its original study.
How often is this updated?
Annually, after each December — since December is 2.8x an ordinary month, no craft-business statistic is finished until the holidays have voted.
KraftStories runs in-person craft workshops in Midtown NYC, NYC Financial District, Honolulu, San Francisco, San Jose, Irvine and Austin, and live virtual workshops worldwide with kits shipped to participants. 4.9 stars across 2,500+ Google reviews. 117+ client companies. Find a studio or plan a team event.